Services
Competitive intelligence
Stay ahead of the competition by understanding their strengths and weaknesses through our competitive intelligence services. Evaluate your performance against industry standards to identify areas for improvement and enhance user experience.


Trusted by Startups, SMEs and Enterprise businesses worldwide


Our expertise
Become the new alpha leader
Get comprehensive intel on how your product stacks against your competition and use it for your own good. Leverage strengths and fix weaknesses before your competitors use them against you.

Audio quality comparison
Evaluate the audio performance of your product against competitors by conducting comprehensive quality assessments. Gain insights into factors like clarity, noise levels, and overall sound fidelity to identify areas for improvement and gain a competitive edge.
Video quality comparison
Compare the video quality of your product with industry rivals through comprehensive testing and analysis. Assess crucial parameters such as resolution, frame rates, compression artifacts, and color accuracy to ensure your solution delivers a superior viewing experience.


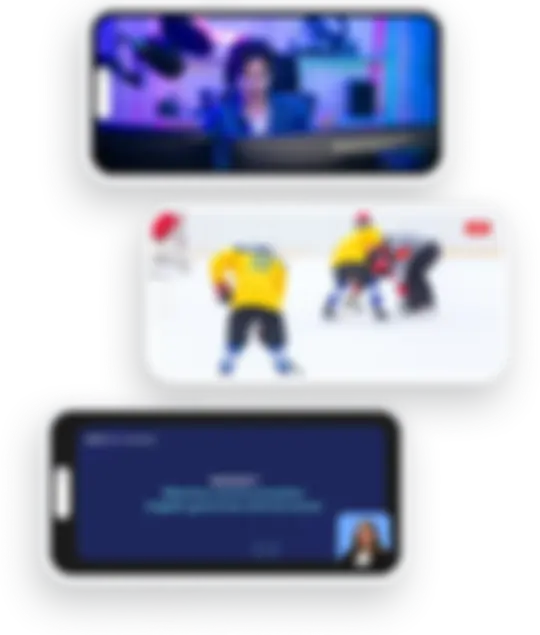
Discover how Zoom leveraged our competitive analysis
We helped Zoom compare their solution against competitors and assess performance under different network conditions—turning data into actionable insights.
When you may need it
Compare your app from every angle
Identify strengths, weaknesses, and opportunities in your product and those of your competitors. Use competitive intelligence to uncover gaps in the market, refine your strategies, and confidently steer your business toward success.


Tech stack
The technology behind precise assessments
To deliver accurate assessments and actionable insights, we use a combination of industry-standard tools and custom-developed technologies and methodologies.
- POLQA
- ViSQOL
- VMAF
- SSIM
- PSNR
- UVQ
- Frame rate
- VQTDL
- AQTDL

Platforms
Test performance on top devices
Test your app on the world’s most used devices. With our 5000+ device farm, we align testing with your users' preferred platforms to maximize compatibility, performance, and user satisfaction.
- Mobile
- Desktop
- Web
- TV
- SDK
- Embedded
Coverage
Quality analysis for all app types
Tap into our 10 years of experience in audio and video quality testing and get detailed competitive analysis and benchmarking insights for any solution using audio and video.
- Video conferencing
- Streaming
- Real-time communications
- Video-on-demand
- Audio-on-demand
- Short form videos
Test Results
Actionable data that drives continuous improvement
Get a complete overview of audio and video quality. Our comprehensive reports provide everything you need to analyze, optimize, and enhance your audio and video performance.
Deliver the quality your users deserve!
Join world-class companies in paving the way for quality audio and video experiences.